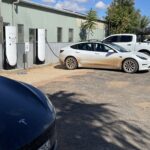
My best real range in my EV is 610km and my lowest real range is 340km. My average real world range at 110km/hr when new was ~460-500km, now after 4 yrs ~ 410-450km.
The figure is simply how far I traveled by the odometer divided by what percentage of my battery I used, expressed as km per 100%.
The highest real EV range
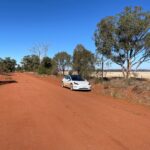
Highest real range in my EV has been 610km for 100% of battery, in warm summer weather, from Bathurst to Sydney in summer of 2024.
The lowest real EV range
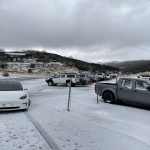
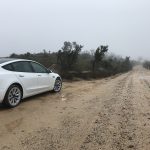
Lowest real range in my EV, was 340km per 100% of battery, driving uphill during very cold wet weather, in Winter of June 2023. I had left Gundagai and travelled 174km uphill at 110km/hr to Goulburn, arriving in 6°C, having used 51% battery. For the trip overall, from Melbourne to Sydney, my EV averaged 378km for 100% of battery. (808km trip travelling in 0 to 8°C at 110km/h.)
Highway Real Range of EV
Most highway trips in first 2 years 2021-23 were at 110km/hr, and I averaged equivalent to 460km for 100% of battery
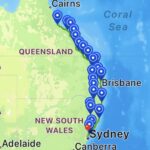
In April 2024, with my 3LR 2yr 7 mths old, my real range on a 4,849km return trip to Townsville at 100-110km/hr varied with conditions from 37.5km to 60.6km per 10% of battery with the overall average 437km per 100% of battery used.
Longest gap between EV chargers
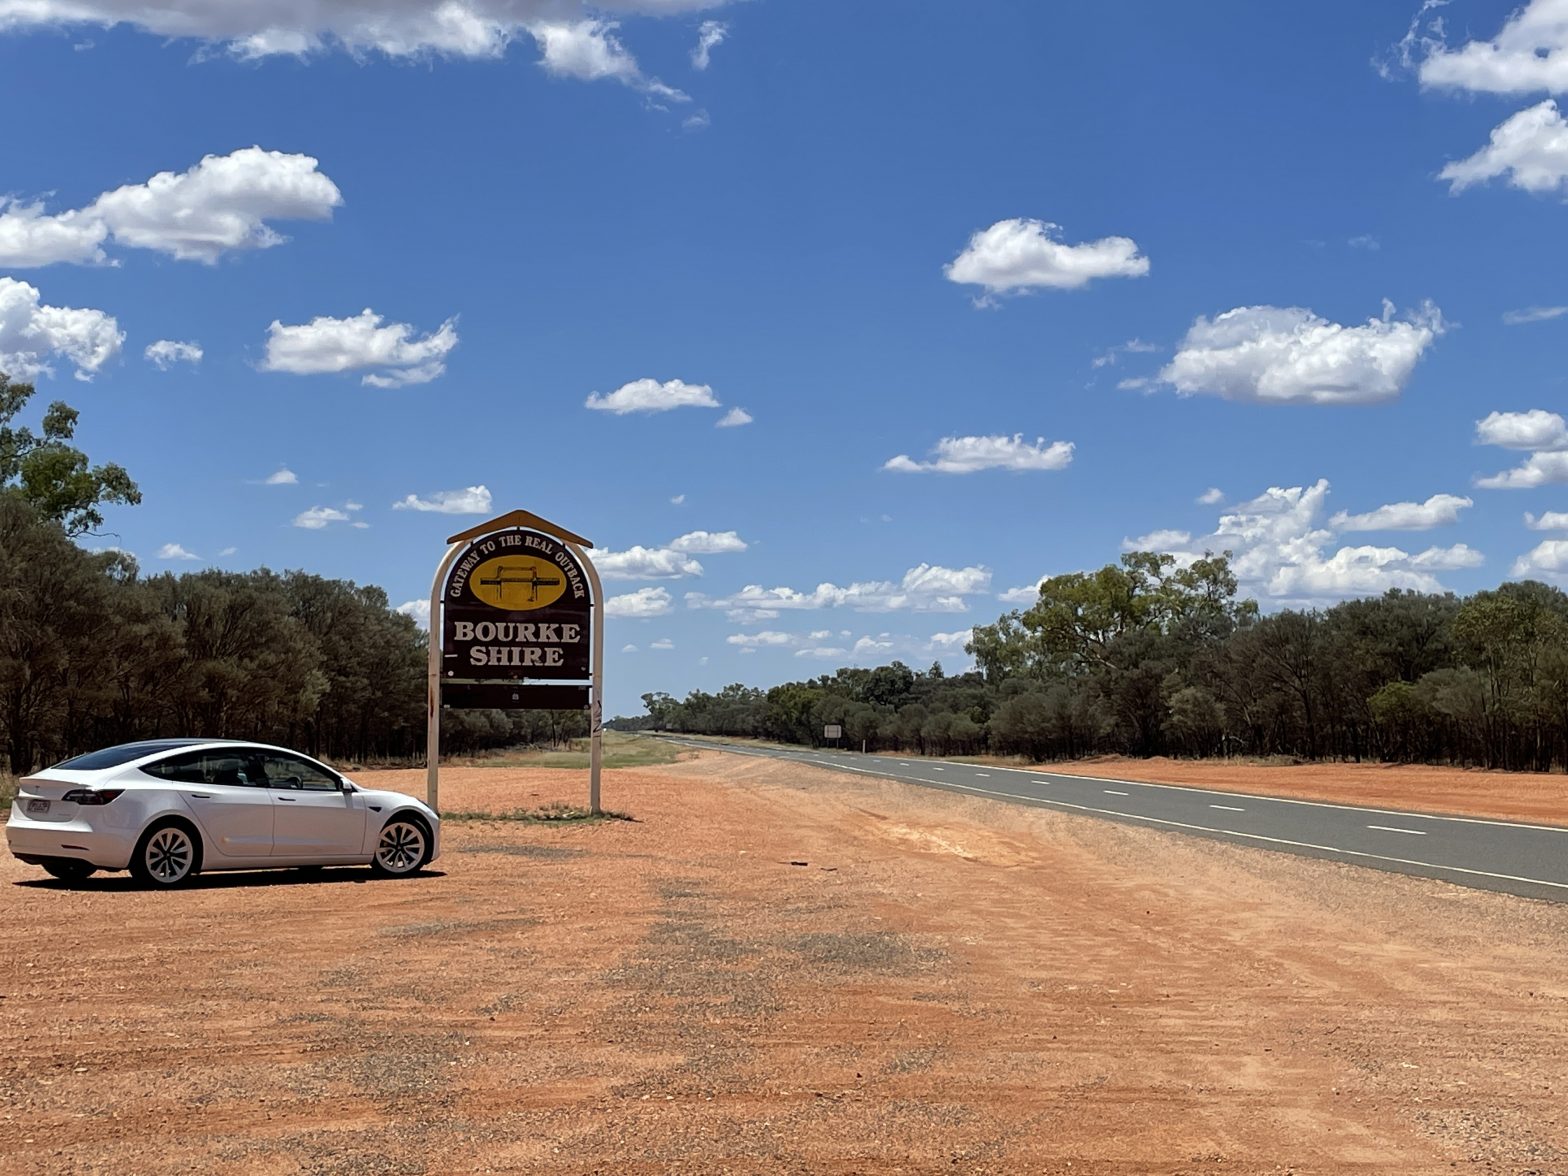
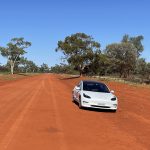
The longest legs I have driven without a EV charger enroute has been 300km between Dubbo and Cobar and the 320km return trip Cobar to Bourke. Neither trip had charging available other than at Dubbo and Cobar, when I did them.
Longest drive without charging
In NSW on 15 Nov 2024, I started with 100% at Dubbo and drove to Sydney at normal highway and freeway speed limits, 110-70km/hr covering 416km arriving with 14%, so 86% used over 416km.

I have also driven my EV in Vic without charging for 367km between Melbourne and Orbost, which used 80% of my battery. There were chargers enroute if needed, but I didn’t use them. The Energy App in the car shows the energy used in driving, plus the other energy used. It used 79.6% of battery in total on that 367.4km trip.

Type of EV
My EV is an August 2021 Tesla 3 LR AWD with the standard 75kWh battery and 19” wheels. (In Nov 2021 they introduced a larger 82kWh battery to the 3 LR AWD, so cars built from Nov 21 will have slightly more range). As of January 2026 my car has travelled 104,319 kms over 4 yrs 4 mths. Trips used as examples above, were in Standard acceleration mode. Tesla recommend driving in Chill acceleration mode during cold weather, if you want to have the most range, but my trips are all in Standard acceleration mode, which uses more energy.
Use of electricity
My lifetime average consumption rate is 150Wh/km or ~15kWh/100km so travelling 1,000km would use ~150kWh of electricity.
Some sample costs of EV charging electricity are set out in the table here.
Roof Racks
in 2025 I fitted Tesla original roof bars before a 2,368km rural trip through Vic and western NSW. My consumption at 100-110km/hr at times was 16-17kWh/100km which is 6-13% higher than normal. It was cool and road surface rough but I think roof bars did increase drag at high speeds.
Change in EV Battery Capacity Over Time
When my car was new, I hadn’t needed to charge to 100%, so I checked EPA range at below 100% and extrapolated the EPA range was about 543, but when a few months old, at 9,472km, I checked the EPA range figure at 100% on my 3LR phone app, which said 548km for 100%. I didn’t think to check it for the next couple of years, but after two years and 59,427km, I checked and it said 513km for 100%, about 93% of original storage.
On 18 July 2025, after 3yr 10mth and 96,052km, my phone app said 100% is 494km, that’s about 90% of the original storage when new.
On 31 December 2025, after 4yrs 3mths and 104,006km, I checked the US EPA protocol rated range at 100% range and it was 486km. That’s a change of -11.3% in battery storage capacity from when new in 2021. The current battery storage capacity (after 4yr3mth 104,600km) is 88.7% of new capacity.
For the year ending 31 Dec 2025, 62% of my kWh was DC charging and 38% was AC charging.
| Date | wdt_ID | wdt_created_by | wdt_created_at | wdt_last_edited_by | wdt_last_edited_at | Odo Kms | EPA Range at about 100% | Battery Storage Capacity % |
|---|---|---|---|---|---|---|---|---|
| 11/10/2021 | 1 | maitland1 | 29/10/2024 04:18 PM | maitland1 | 06/06/2025 09:25 PM | 1,507 | 543 | 99.09 |
| 23/01/2024 | 6 | maitland1 | 29/10/2024 04:29 PM | maitland1 | 05/06/2025 09:18 AM | 59,427 | 513 | 93.61 |
| 01/04/2024 | 7 | maitland1 | 29/10/2024 04:30 PM | maitland1 | 04/06/2025 08:20 PM | 68,274 | 510 | 93.06 |
| 07/08/2024 | 8 | maitland1 | 29/10/2024 04:30 PM | maitland1 | 05/06/2025 03:34 PM | 75,540 | 498 | 90.88 |
| 15/11/2024 | 19 | maitland1 | 29/10/2024 07:21 PM | maitland1 | 05/06/2025 03:36 PM | 81,992 | 500 | 91.24 |
| 18/12/2024 | 22 | maitland1 | 29/10/2024 07:21 PM | maitland1 | 04/06/2025 08:21 PM | 84,170 | 500 | 91.24 |
| 10/03/2025 | 23 | maitland1 | 29/10/2024 07:21 PM | maitland1 | 04/06/2025 08:21 PM | 87,990 | 500 | 91.24 |
| 01/05/2025 | 24 | maitland1 | 29/10/2024 07:21 PM | maitland1 | 04/06/2025 08:22 PM | 92,484 | 503 | 91.79 |
| 12/01/2022 | 27 | maitland1 | 29/10/2024 04:18 PM | maitland1 | 06/06/2025 09:17 PM | 9,472 | 548 | 100.00 |
| 18/07/2025 | 28 | maitland1 | 18/07/2025 09:27 AM | maitland1 | 20/08/2025 06:43 AM | 96,052 | 494 | 90.14 |
| 23/08/2025 | 29 | maitland1 | 18/07/2025 09:27 AM | maitland1 | 23/08/2025 12:08 PM | 98,026 | 494 | 90.15 |
| 28/09/2025 | 30 | maitland1 | 18/07/2025 09:27 AM | maitland1 | 28/09/2025 10:42 AM | 100,019 | 494 | 90.28 |
| 21/11/2025 | 32 | maitland1 | 18/07/2025 09:27 AM | maitland1 | 21/11/2025 02:03 PM | 102,540 | 490 | 89.41 |
| 31/12/2025 | 33 | maitland1 | 18/07/2025 09:27 AM | maitland1 | 31/12/2025 04:52 PM | 104,006 | 486 | 88.69 |
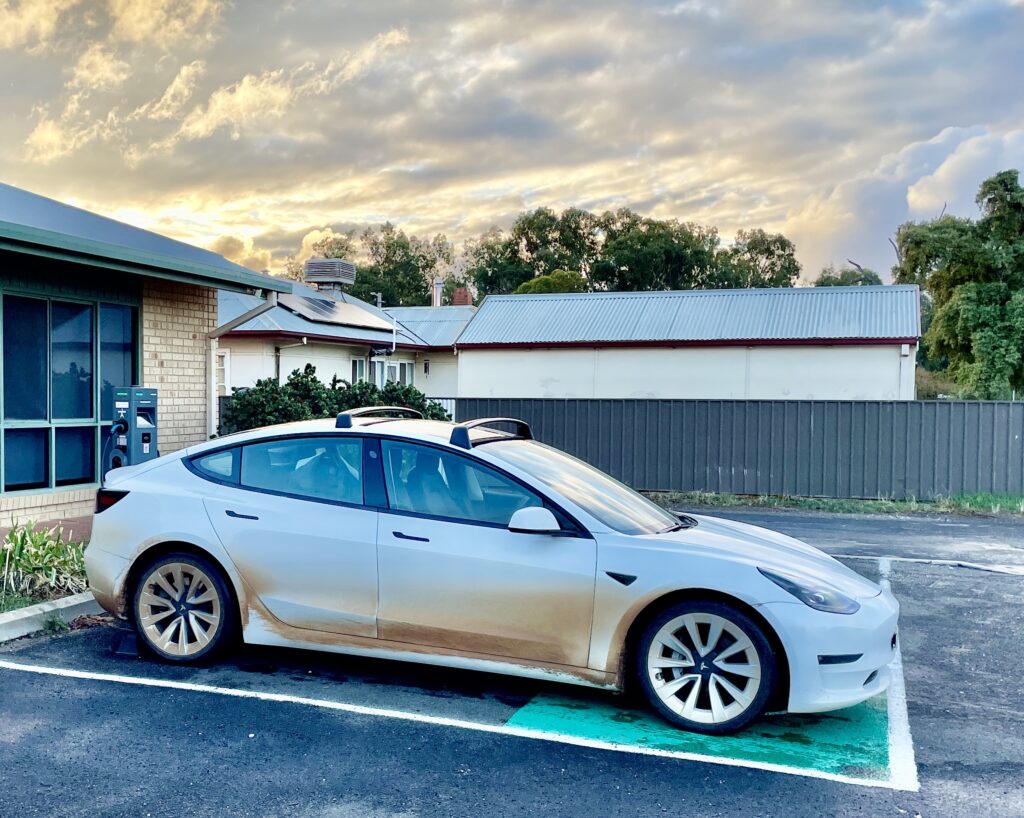
The initial reduction in storage capacity, followed by a levelling off, is consistent with the graph published by Tesla, based on their global stats for the model 3 and Y.
Tesla says it’s normal for storage capacity and therefore estimated range to decrease slightly before levelling off. Over time, you may see a gradual, but natural, decrease in range at full charge – this depends on factors such as the mileage and age of the Battery.
Tesla says that average capacity reduction for the batteries in Model 3 and Model Y is 20% on average, regardless of battery chemistry after 320,000 kms (200,000 miles).
WLTP, EPA and ADR EV range figures
The WLTP and EPA test ranges are just different lab test protocols for comparisons between cars only, not real range. The WLTP test is a 30 minute lab test with average speed without stops of 53.5km/hr. My WLTP range for my 2021 3LR AWD was 580km but that is not displayed in the car. It’s the EPA test range that is displayed.
The driving range displayed on the top of the car touchscreen and app, shows an estimate of how far the car would travel with its current battery level, under the USA EPA lab test. When my 3LR AWD was new at 100% the EPA figure was 548km. The EPA figure displayed is based on 55% city cycle and 45% highway cycle EPA test protocol, that’s why on long highway trips, you will have less range than the EPA figure.
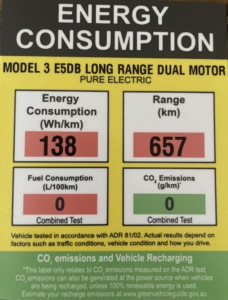
A third type of test is the ADR lab test. The Australian ADR 81/02 lab test is used on the fuel consumption windshield sticker in Australia. The Australian ADR 81/02 has a test phase average speed of 19km/hr in stop start traffic and long periods of idling and a second phase with average speed of 63km/hr. There is no testing for long periods of highway driving. The sticker from a 2021 Tesla 3LR, shows an implausible range of 657km, 77km more than the WLTP figure advertised by Tesla for that model of 580km. The test protocol would require driving at no more than average speeds of 19-63km/hr to get close to that range.
The Energy App vs the Trip Meter
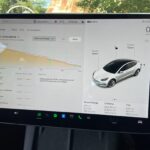
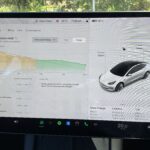
For real time energy use and range, refer to the Energy App, in the Apps section of your car’s touchscreen. It gives a breakdown of the total energy used by your car while driving and parked.
Example
I find the trip meter kWh reflects energy used in driving and the Energy App shows the driving energy plus the rest. For example, if you park overnight with Sentry on your battery level % may decrease about 5% but your Total Energy on your trip meter won’t have changed as you haven’t used any energy driving. For example, in May 2024, I parked with Sentry on at a motel in Warwick Qld at 4:33pm with energy used since charge at 12kWh and 61% battery capacity. Next day, 13 hours later at 7:39am, battery had dropped to 57% but energy used since charge was still 12kWh. The car used 4% overnight, equal to about 3kWh, but that is not shown on the trip meter under any of the energy used figures.
References
Tesla on range https://www.tesla.com/ownersmanual/model3/en_au/GUID-4AC32116-979A-4146-A935-F41F8551AFE6.html?fbclid=IwAR1j4hHC30aUd-lSrp1TfwrJo1FemBXitO5z2ZrnFtfMyyVbAbyHgxV5ux8
Tesla on battery life https://www.tesla.com/en_au/impact
Tesla on WLTP https://www.tesla.com/en_au/support/range-calculator-ref
Tesla on Cold Weather https://www.tesla.com/en_au/support/range#cold-weather
EV Database Real Ranges
https://ev-database.org/car/1321/Tesla-Model-3-Long-Range-AWD
ADR81/02 https://greenvehicleguide.gov.au/pages/ToolsAndCalculators/FuelConsumptionLabel
Vehicle Standard (Australian Design Rule 81/02 – Fuel Consumption Labelling for Light Vehicles) 2008
https://www.legislation.gov.au/F2008L00649/latest/text
WLTP https://en.m.wikipedia.org/wiki/Worldwide_Harmonised_Light_Vehicles_Test_Procedure
USA EPA
USA EPA 2024 Model Guide
https://fueleconomy.gov
https://www.epa.gov/greenvehicles/fuel-economy-and-ev-range-testing
